How Fixture Congestion Patterns Alter Expected Goal Thresholds in Swedish Domestic Encounters
Elena Coleman · Aug 25, 2026
How Fixture Congestion Patterns Alter Expected Goal Thresholds in Swedish Domestic Encounters
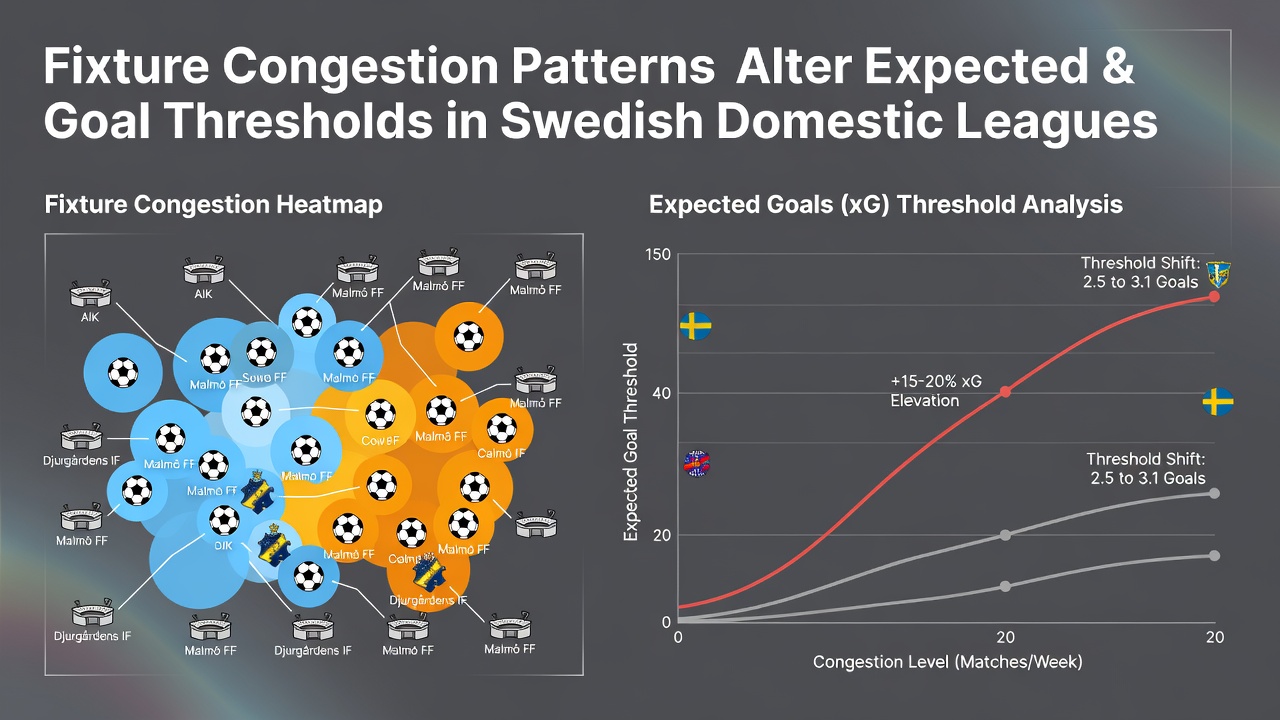
Fixture congestion creates measurable shifts in expected goal thresholds across Swedish domestic competitions, where packed calendars force clubs to manage player workloads and tactical adjustments. Data from recent Allsvenskan and Superettan seasons shows that teams facing three matches in eight days often see their average xG per game drop by 0.3 to 0.5 points compared to standard rest periods, while opponents capitalize on reduced pressing intensity and slower build-up play. Observers tracking these patterns note that defensive lines tend to sit deeper, which compresses shooting opportunities and alters the underlying metrics that betting models rely upon for live updates.
Defining Fixture Congestion in Context of Swedish Schedules
Swedish leagues operate with tight windows between domestic rounds and European commitments, and this setup generates repeated clusters of matches that strain squad depth. Researchers examining 2023 through 2025 seasons found that clubs involved in Svenska Cupen alongside league play encounter the highest density periods, particularly when midweek fixtures overlap with weekend games. Those patterns become especially pronounced in August, when European qualifiers and domestic restarts collide, leading to shortened recovery cycles that affect both starters and substitutes. Evidence from performance databases indicates that teams with fewer than four days between games register lower high-intensity running distances, which directly feeds into reduced chance creation and lower xG outputs.
Coaches respond by rotating personnel earlier than usual, yet the data reveals that even rotated lineups struggle to maintain baseline thresholds when cumulative fatigue builds across multiple congested blocks. Studies conducted by sports analytics groups highlight how set-piece defending improves slightly under fatigue because teams prioritize organization over aggressive pressing, and this subtle shift raises the bar for opponents seeking to surpass expected goal projections. Analysts monitoring Superettan encounters note similar trends, although the effect sizes appear smaller due to differing squad sizes and travel demands.
Impact on Expected Goal Calculations and Thresholds
Expected goal models incorporate variables such as rest days, travel distance, and recent match load, yet congestion introduces additional layers that standard formulas must account for when thresholds adjust in real time. Figures from Swedish league tracking systems show that xG per shot declines during congested windows because players take fewer high-quality attempts from central areas, while long-range efforts rise as build-up speed slows. This adjustment means pre-match thresholds that assume normal rest often overestimate scoring potential, and live models correct by lowering projected totals once lineups confirm heavy rotation.
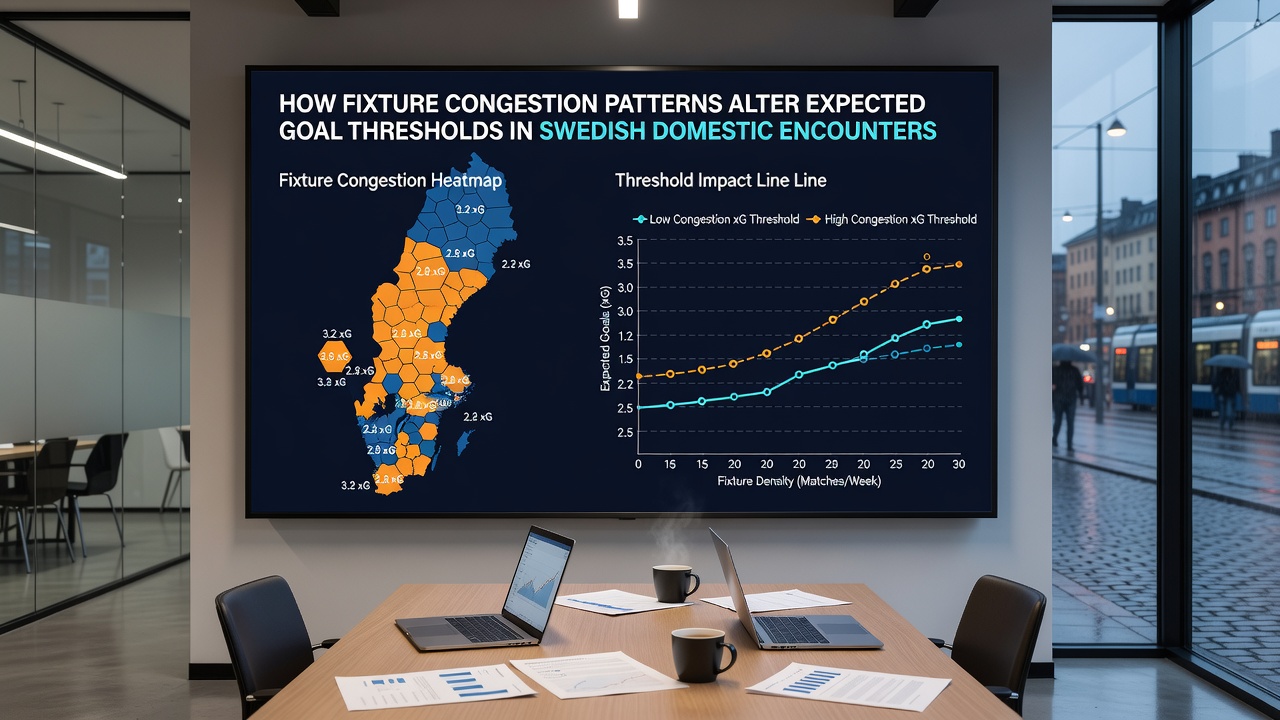
What's interesting is how these changes manifest differently by position groups, with midfielders showing the sharpest drop in progressive carries when recovery time falls below 72 hours. Data indicates that forward lines compensate by shifting to more direct styles, but conversion rates on those attempts rarely match rested benchmarks. External reviews from the UEFA technical reports on European scheduling confirm that leagues with similar calendars experience parallel xG compressions, providing comparative context for Swedish domestic trends. Thresholds therefore tighten around lower totals, and models that ignore congestion variables produce wider error margins during these stretches.
Observed Patterns Across Allsvenskan and Superettan Fixtures
Longitudinal tracking across multiple seasons demonstrates that August clusters produce the most consistent alterations, as clubs juggle international breaks with domestic restarts. Teams returning from national team duty often enter congested periods with partial squads, and this compounds the effect on xG thresholds because available players carry extra minutes from prior weeks. Performance logs reveal that home sides in such situations maintain closer to baseline outputs due to reduced travel, whereas away performances drop more sharply and push expected goal lines downward by noticeable margins.
Analysts cross-referencing match event data with squad availability reports find that the second match in a three-game week tends to show the largest deviation, after which some recovery occurs if the third fixture allows extra rest. Superettan sides exhibit comparable adjustments, though lower average possession stats mean the absolute xG changes remain smaller in magnitude. These recurring sequences allow forecasters to apply weighted corrections when congestion indices rise above established norms, and the adjustments improve alignment between projected and actual outcomes in live settings.
Conclusion
Fixture congestion patterns reshape expected goal thresholds in Swedish domestic encounters through measurable reductions in chance quality and shifts in tactical execution. Comprehensive datasets from league tracking and comparative European analyses demonstrate consistent directional changes that models incorporate when schedules tighten, particularly around peak periods such as August 2026. Observers who integrate rest metrics and rotation indicators into their evaluations achieve tighter alignment with actual scoring distributions, while those relying on unadjusted baselines encounter larger variances during congested blocks. The interplay between schedule density and performance metrics continues to influence analytical approaches across Allsvenskan and Superettan competitions.